
My new article Researching Lay Perceptions of Inequality through Images of Society: Compliance, Inversion and Subversion of Power Hierarchies has been published in Sociology journal.
Cite: Vanke, A. (2023). Researching Lay Perceptions of Inequality through Images of Society: Compliance, Inversion and Subversion of Power Hierarchies. Sociology, 0(0). https://doi.org/10.1177/00380385231194867
The article enhances our understanding of affective and imaginative power of social class by focusing on ordinary people’s lay perceptions of inequality in the example of Russia. I draw a special attention to the social imaginary by which I mean people’s capacity to evoke images in imagination and produce alternative visions of the future. This understanding follows from the conceptualisations of imaginary by Cornelius Castoriadis, Raymond Williams and Karine Clément. The article also explores the moral and symbolic signifiers of class, as well as a sense of inequality and a sense of social justice being formed within socio-material urban infrastructures.

The article may be of interest of those who apply (or would like to learn how to apply) arts-based methods in qualitative and innovative research. It explains how to utilise the method of ‘drawing of society’ initially introduced by Alexander Bikbov in his cross-national study of pupils’ and students’ perceptions of inequality and social justice. In my research, I develop this arts-based method in a multi-sited ethnography of deindustrialising communities in two major post-industrial cities of Russia.
I integrated the method of a drawing of society in an ethnographic interview. During the interviews, I asked research participants to draw Russian society and then explain what they drew. My database includes 35 drawings of society. I complemented these data with observation in deindustrialising urban areas where my ethnography took place.
The article explains in detail how to analyse drawings of society with other multi-sensory data.
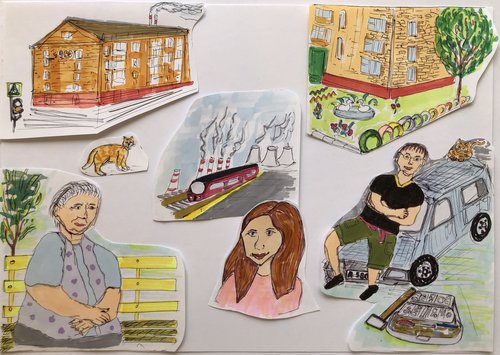
My empirical research has shown that the members of deindustrialising communities, including workers and professionals, tend to imagine Russian society as divided between a small number of the rich and a large number of the poor, and as consisting of morally signified social classes.
I support this argument with three examples of images of society created by my research participants.
First, the image of a pyramid of classes was the most popular in my dataset. These drawings demonstrate a top-down power dynamic in Russian society visualising clear divisions between social classes. They often express ordinary people’s compliance with the established social order.
Second, I analyse the images of society with social portraits of people belonging to different social classes or classed groups. One of them is a drawing of ironically inverted power hierarchy in which the rich appeared to be depicted at the bottom, while the poor at the top. Notably, the middle class is absent in this drawing.
Finally, I analyse the image of a class conflict created by one research participant with the radical imagination. In this drawing, Russian society is divided between the greedy capital holders and ordinary people sub-divided into the active working classes and sleeping ‘vegetables’. This image shows an accumulation of ‘power from below’ aimed to subvert or challenge power hierarchy.
I support this argument with more evidence and examples in one chapter of my forthcoming book The urban life of workers in post-Soviet Russia: Engaging in everyday struggle, which is available to pre-order at the website of Manchester University Press or your preferred bookseller.